
| Detecting JavaScript Errors |
To learn how to detect JavaScript errors for each browser
Use of JavaScript Console
You may encounter some problems when using JavaScript, caused by description errors and so on.
In such cases, with browsers like Netscape and Mozilla Firefox, you can detect the description errors using a function called “JavaScript console.”
In the case of Netscape (and Mozilla as well)
Select from the “Tool” menu of Netscape, “Web Development” → “JavaScript Console”.
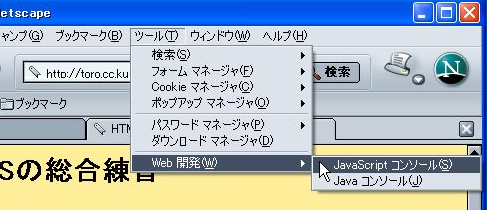
Then the following JavaScript Console is displayed.
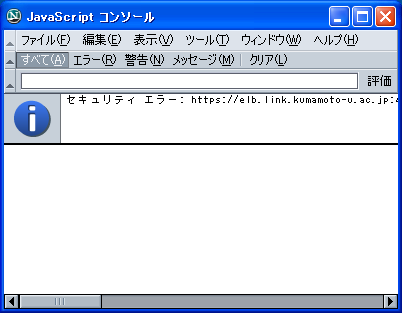
When this is displayed, first click on the “Clear” menu to clear all the errors that occurred so far.
Next, access the page using the JavaScript, which displays the errors occurring on this page.
In the case of Mozilla Firefox
Select from the “Tool” menu, “JavaScript Console.”
In the case of Opera
Select from the “Tool” menu, “Detailed tools”→“JavaScript Console”
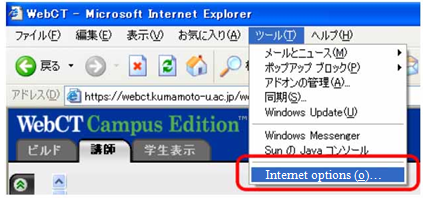
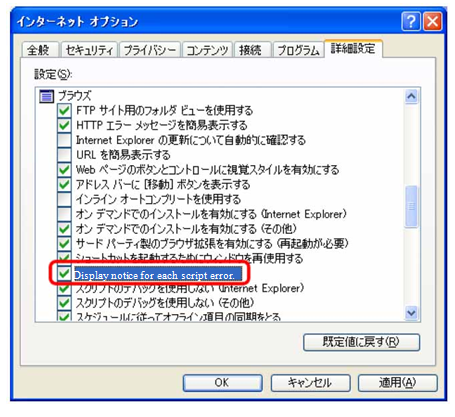
In the case of Internet Explorer
Although Internet Explorer does not have the function of “JavaScript Console”, you can have the errors displayed by setting up as follows.
(1)Select from the “Tool” menu, “Internet options.”
(2)When the “Internet options” window is opened, click on “Advanced Settings.”
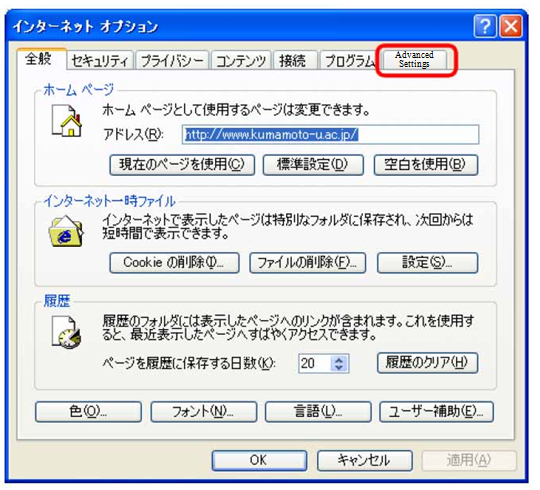
(3)Then, in the browsing column, check on “Display notice for each script error.”
When an error is displayed, make sure to distinguish if the error is related to the page you created. If you have frequent error display, click on the “Clear” menu to clear the error displays, and then access again the page you created.