
| Creating Graphs |
[The purpose of this section]
Practice making graphs using the data in spreadsheets.
Practice making graphs using the data in spreadsheets.
Creating Graphs
In spreadsheets, it is easy to make graphs based on tables. Various types of graphs such as bar charts, pie charts, line graphs, etc. can be created. In particular, in StarSuite Calc special types of charts such as 3D charts can be created.
[Practice 25]
In the file ex3.sxc which you have been working on, create graphs according to the following instructions. If you have time, practice changing the properties of the graphs and graph types. Do not forget to overwrite save the file.
In the file ex3.sxc which you have been working on, create graphs according to the following instructions. If you have time, practice changing the properties of the graphs and graph types. Do not forget to overwrite save the file.
The general procedure for creating graphs is as follows.
- Select the data range to be converted into a graph.
It is important to include the headings. - Create a graph following the wizard.
You only have to select "Graph" from the "Insert" menu, and follow the guide. - Modify the graph.
Modify the format of the various objects such as title to complete the graph.
Let's make a graph now.
First, select the data range to be converted into a graph, including the headings.
Select "Graph" from the "Insert" menu.
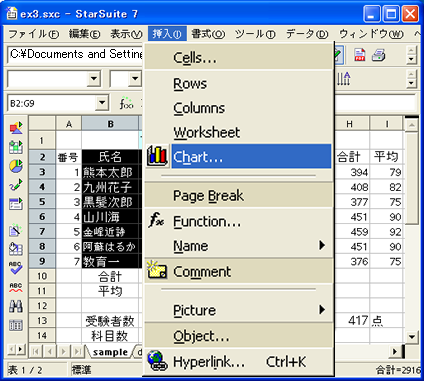
All that is left is to follow the wizard.
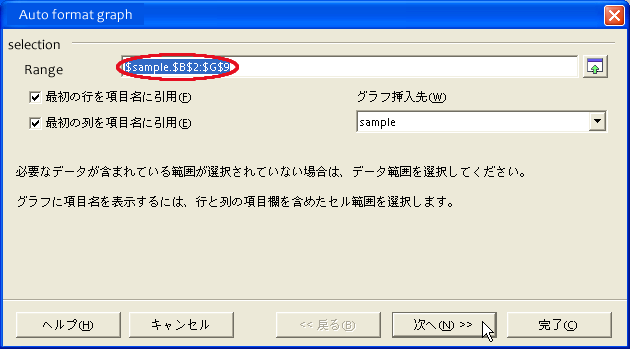
Confirm the selected range and click "Next".
(Note)Note that the range is specified using the absolute reference.
Select the graph type. Select "Bar chart" here.
Check the box "Display text" in order to display the axis names and the title.
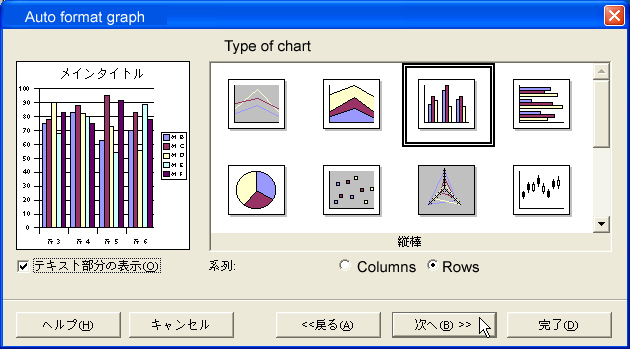
Select the type of bar chart. Select "Buildup" here and click "Next".
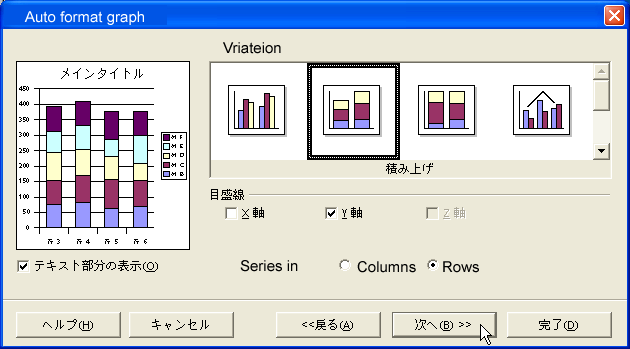
(Note) If you select "Row" in the "Grouping" field, the subject name becomes the horizontal axis.
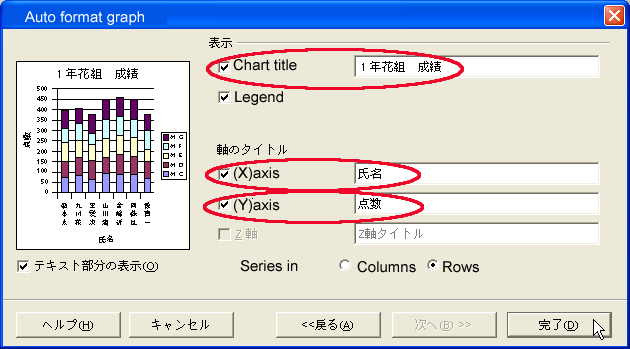
Input the graph title and axis title in the last dialog and press the "Complete" button. That's all.
(Note) A graph legend is "hanrei" in Japanese. Do not read it "bonrei". Do you know which part is the legend? Confirm it by un-checking the legend box.

Modifying Graphs
Once a graph is created, you can modify it in various ways as required.
There are the following two modes for modifying graphs.- Normal Selection Mode (Object Selection Mode)
Mode to treat objects like images in word processors. In this mode, graphs can be moved, resized, copied and pasted, and so on. - Graph Modification Mode
Mode to change the format of the graph factors. Right after a graph is created with wizard, the graph is in this mode.
Normal Selection Mode (Object Selection Mode)
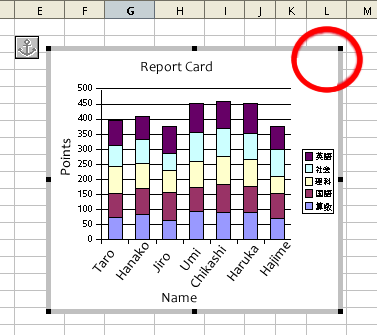
Graphs enter this mode when clicked.
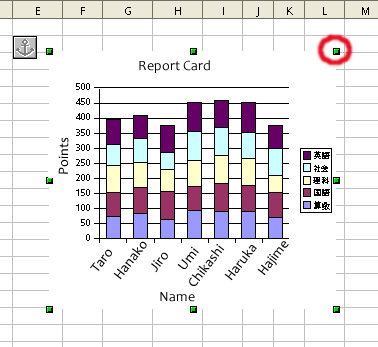
In this mode, green handles are displayed.
In this mode, green handles are displayed.
- Resizing Graphs
The graph can be resized by dragging the green handles.
Hold down the Shift key and drag the handle to maintain the aspect ratio.
- Moving Graphs
The graphs can be moved by click-holding somewhere on the graph other than on a green handle and then dragging it. - Copying and Pasting Graphs
Graphs can be copied by right-clicking the mouse and selecting "Copy" or holding down the Ctrl key and pressing the C key. The copied graph can be pasted in a different place in the same sheet or in a file created using a different software application.
Graph Modification Mode
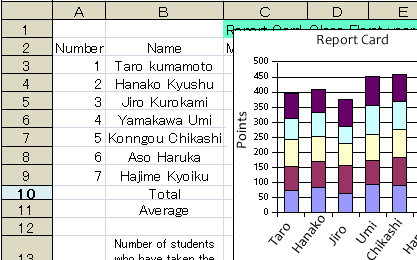
Graphs enter this mode whendouble-clicked.
In this mode, the graph area is surrounded by a gray frame and gray handles are displayed.
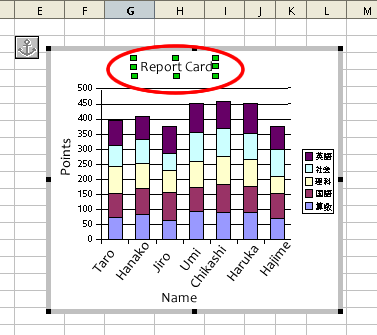
Graph titles, axis titles, and legends in a graph are treated as independent objects in this mode. So each object can be moved by selecting (clicking) and dragging. Properties of each object can be changed by right-clicking.
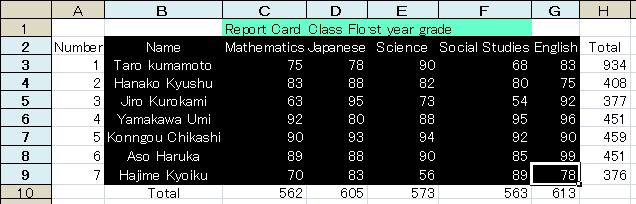
In the following illustration, the main title "Report Card, Class Flower, First Year Grade" is clicked and selected. In this mode, the main title can be moved by dragging it, the text of the title can be edited by double clicking on it, and properties of the text can be changed by right-clicking on it.
(Note) If the axis titles are not specified initially, they cannot be added directly in the graph modification mode. In such a case, right-click the mouse in the graph modification mode and select "Auto-format" as follows.
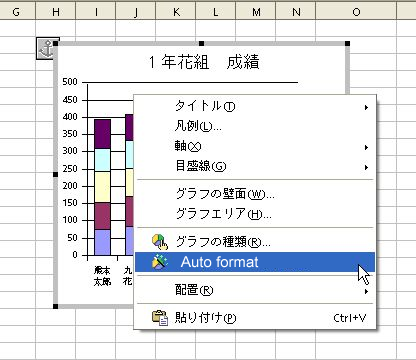
Then the setting dialog is displayed again. Click "Next" and you can specify the axis titles and so on.

In this mode, the graph area is surrounded by a gray frame and gray handles are displayed.
Graph titles, axis titles, and legends in a graph are treated as independent objects in this mode. So each object can be moved by selecting (clicking) and dragging. Properties of each object can be changed by right-clicking.
In the following illustration, the main title "Report Card, Class Flower, First Year Grade" is clicked and selected. In this mode, the main title can be moved by dragging it, the text of the title can be edited by double clicking on it, and properties of the text can be changed by right-clicking on it.
(Note) If the axis titles are not specified initially, they cannot be added directly in the graph modification mode. In such a case, right-click the mouse in the graph modification mode and select "Auto-format" as follows.
Then the setting dialog is displayed again. Click "Next" and you can specify the axis titles and so on.